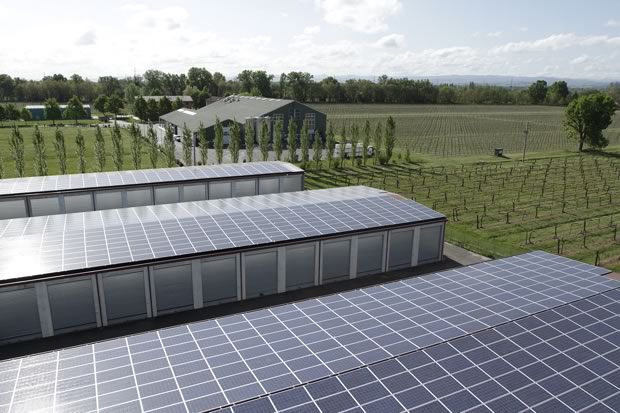
WIND
POWER HISTORY
2011
08 April 2011
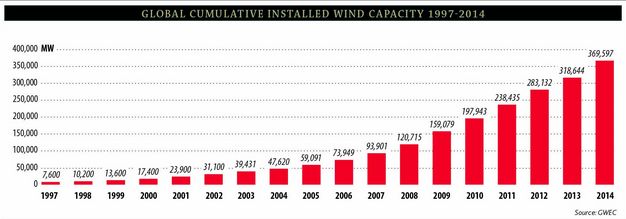
Worldwide
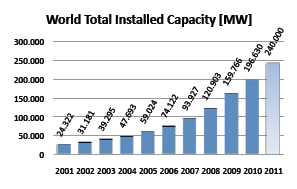
Wind Capacity reaches 197 GW
- China becomes world leader, installing 18,9 Gigawatt, more than
50 % of the world market
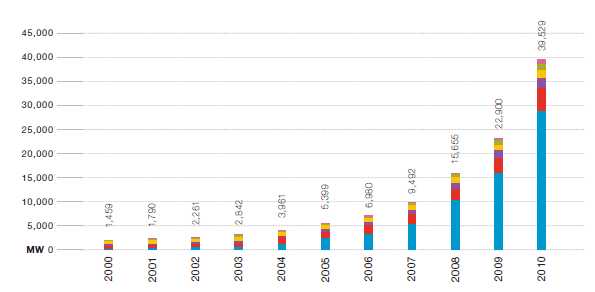
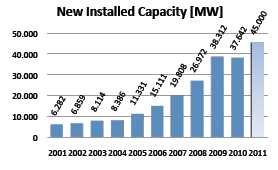
- Worldwide capacity reached 196630 Megawatt, out of which 37642
Megawatt were added in 2010, slightly less than in 2009.
- Wind power showed a growth rate of 23,6 %, the lowest growth
since 2004 and the second lowest growth of the past decade.
- All wind turbines installed by the end of 2010 worldwide
can generate 430 TWh per annum,
more than the total electricity demand of the United
Kingdom,
the sixth largest economy of the world, and equalling 2,5
% of the global electricity consumption.
- The wind sector in 2010 had a turnover of 40 billion Euro and
employed 670000 persons worldwide.
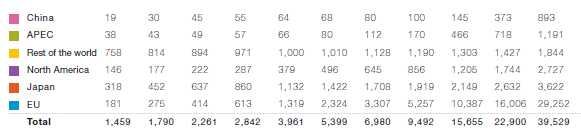
- China
became number one in total installed capacity and the center of
the international wind industry, and added 18928 Megawatt within
one year, accounting for more than 50 % of the world market for
new wind turbines.
- Major decrease in new installations can be observed in North
America and the USA lost its number one position in total
capacity to China.
- Many Western European countries are showing stagnation,
whereas there is strong growth in a number of Eastern European
countries.
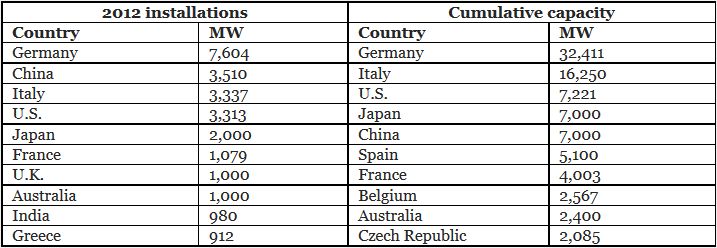
- Germany keeps its number one position in Europe with
27215 Megawatt, followed by Spain with 20676 Megawatt.
- The highest shares of wind power can be found in three European
countries: Denmark (21 %), Portugal (18 %) and Spain 16 %).
- Asia accounted for the largest share of new installations
(54,6 %), followed by Europe (27,0 %) and North America (16,7
%).
- Latin America (1,2 %) and Africa (0,4 %) still played
only a marginal role in new installations.
- Africa: North Africa represents still lion share of installed
capacity, wind energy plays hardly a role yet in Subsahara Africa.
- Nuclear disaster in Japan and oil spill in Gulf of Mexico will
have long-term impact on the prospects of wind energy. Governments
need to urgently reinforce their wind energy policies.
- WWEA sees a global capacity of 600
GW as possible by the year 2015 and more than 1500
GW by the year 2020.
Visit also WWEA's interactive
world map with statistical information about all countries
that use wind energy